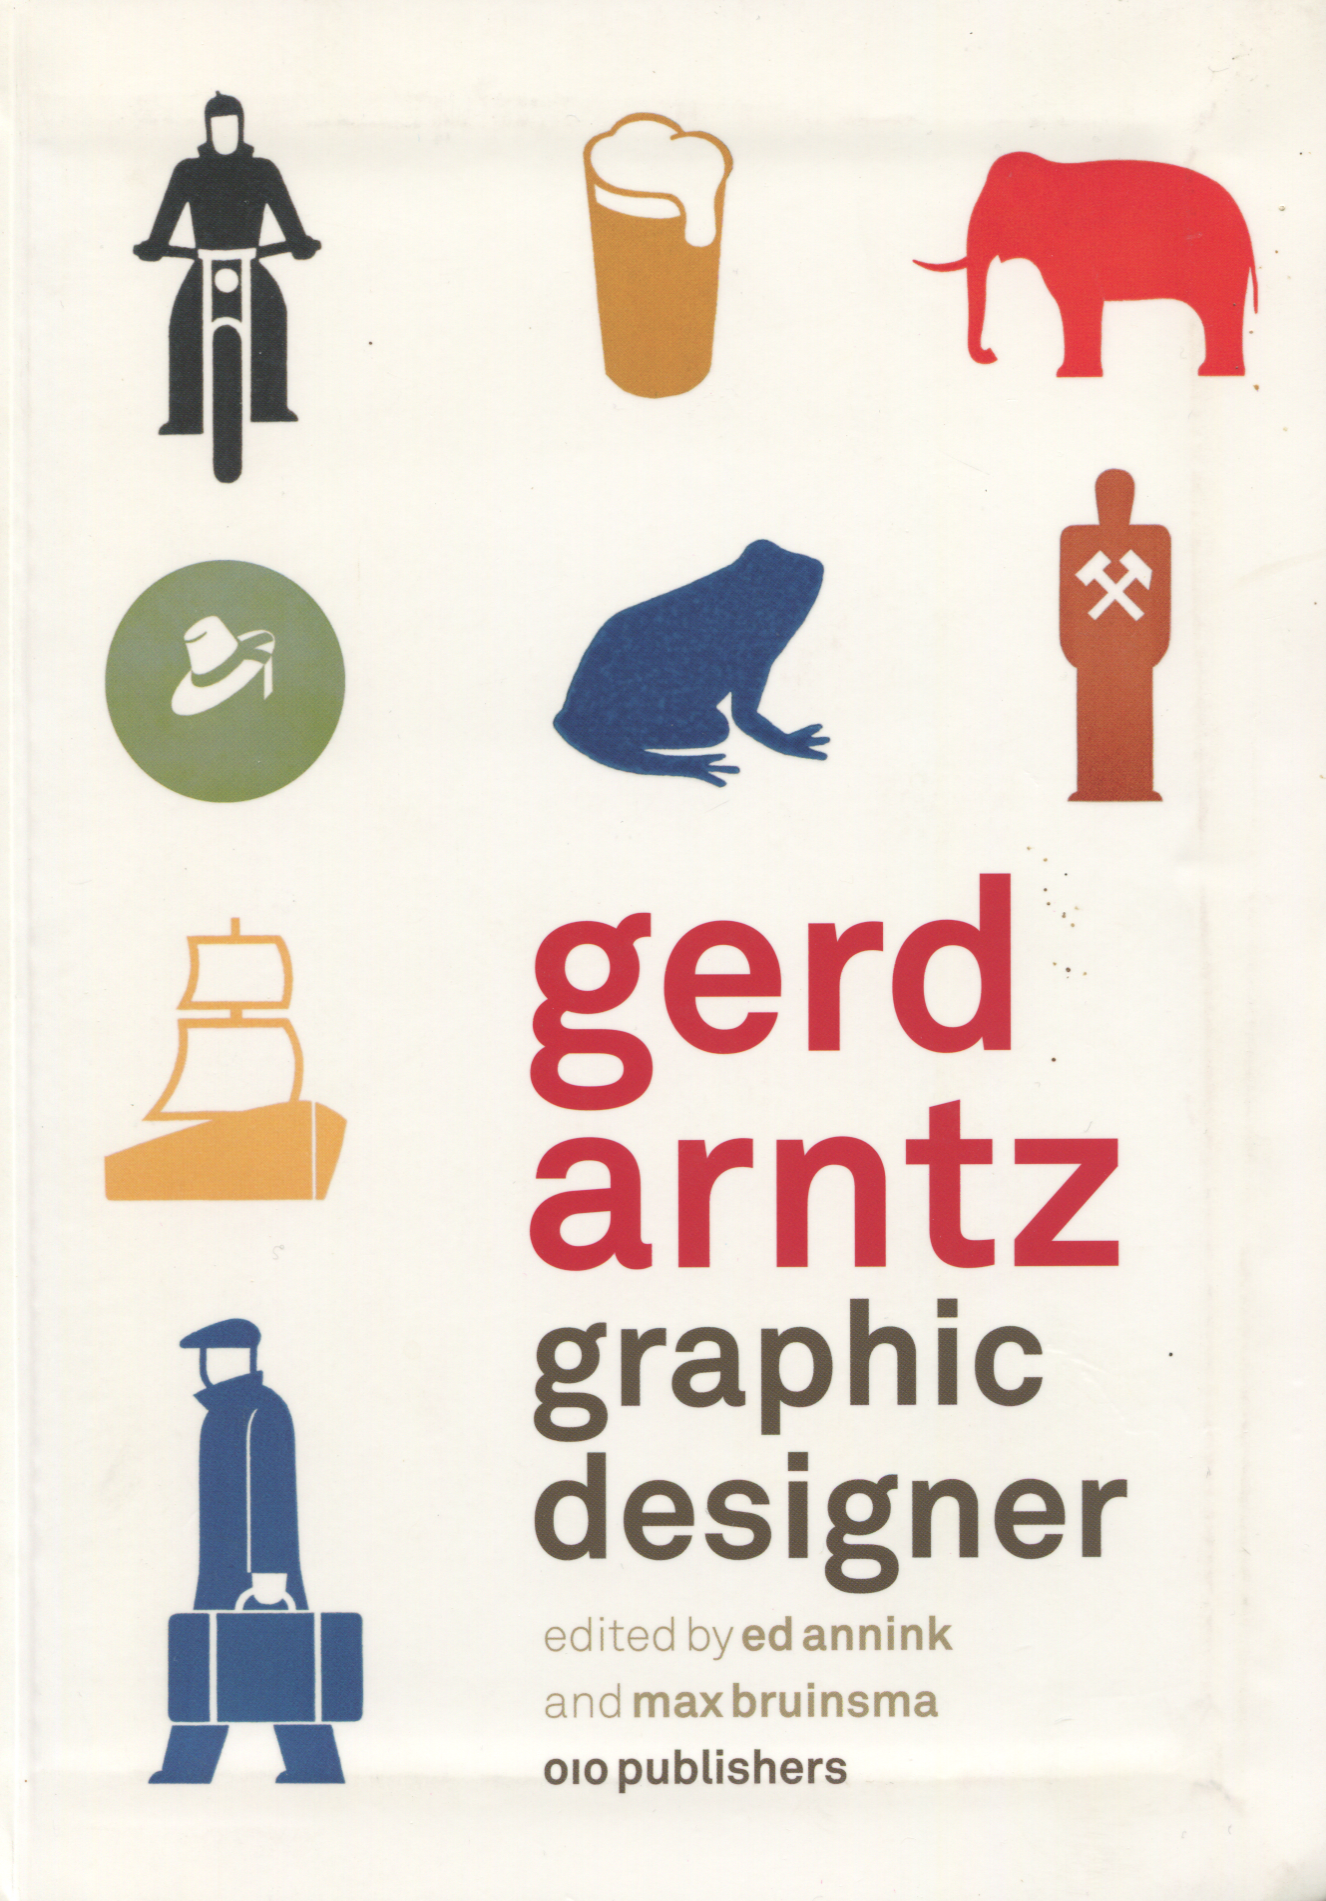
Gert Arntz provided the graphic depiction of Otto Neurath’s ideas on statistics. His images were termed Isotypes (International System of TYpographic Picture Education) as part of Neurath’s project to provide statistical information to the general public in accurate and accessible ways during the turbulent European scene between the first and second world wars.
Neurath explored ways to represent numbers so their significance was obvious to all whatever their education. At a time when propaganda was rife with untruths, he was very committed to communicating educational material to civic society. Below is one of the main formats he arrived at — the horizontal depiction of number.
In this example below, we see statistics for unemployment. Note the way the figure is composed. We will explore this soon.
The image is highly suggestive of the mental state of the unemployed. Notice the slump and the lowered head. Here is another with still more pronounced mental anguish.
Such figures were highly schematised and based on strict proportions.
These protocols for drawing were applied to a variety of postures, actions and roles.
Gerd Arntz’s legacy carries on. There won’t be a single graphic artist who hasn’t studied him, and most will have copied his style at some time. Pretty much most of the infographic and data visualisations in magazines and newspapers are direct descendants of Gerd Arntz.


